
Email Sequence Benchmarks 2026: Reply Rates by Industry and Role
A good cold email reply rate in 2026 is 5-10% of total sends for tightly targeted campaigns, and 10-15% is excellent. Sector medians run lower: staffing 5-8%, a
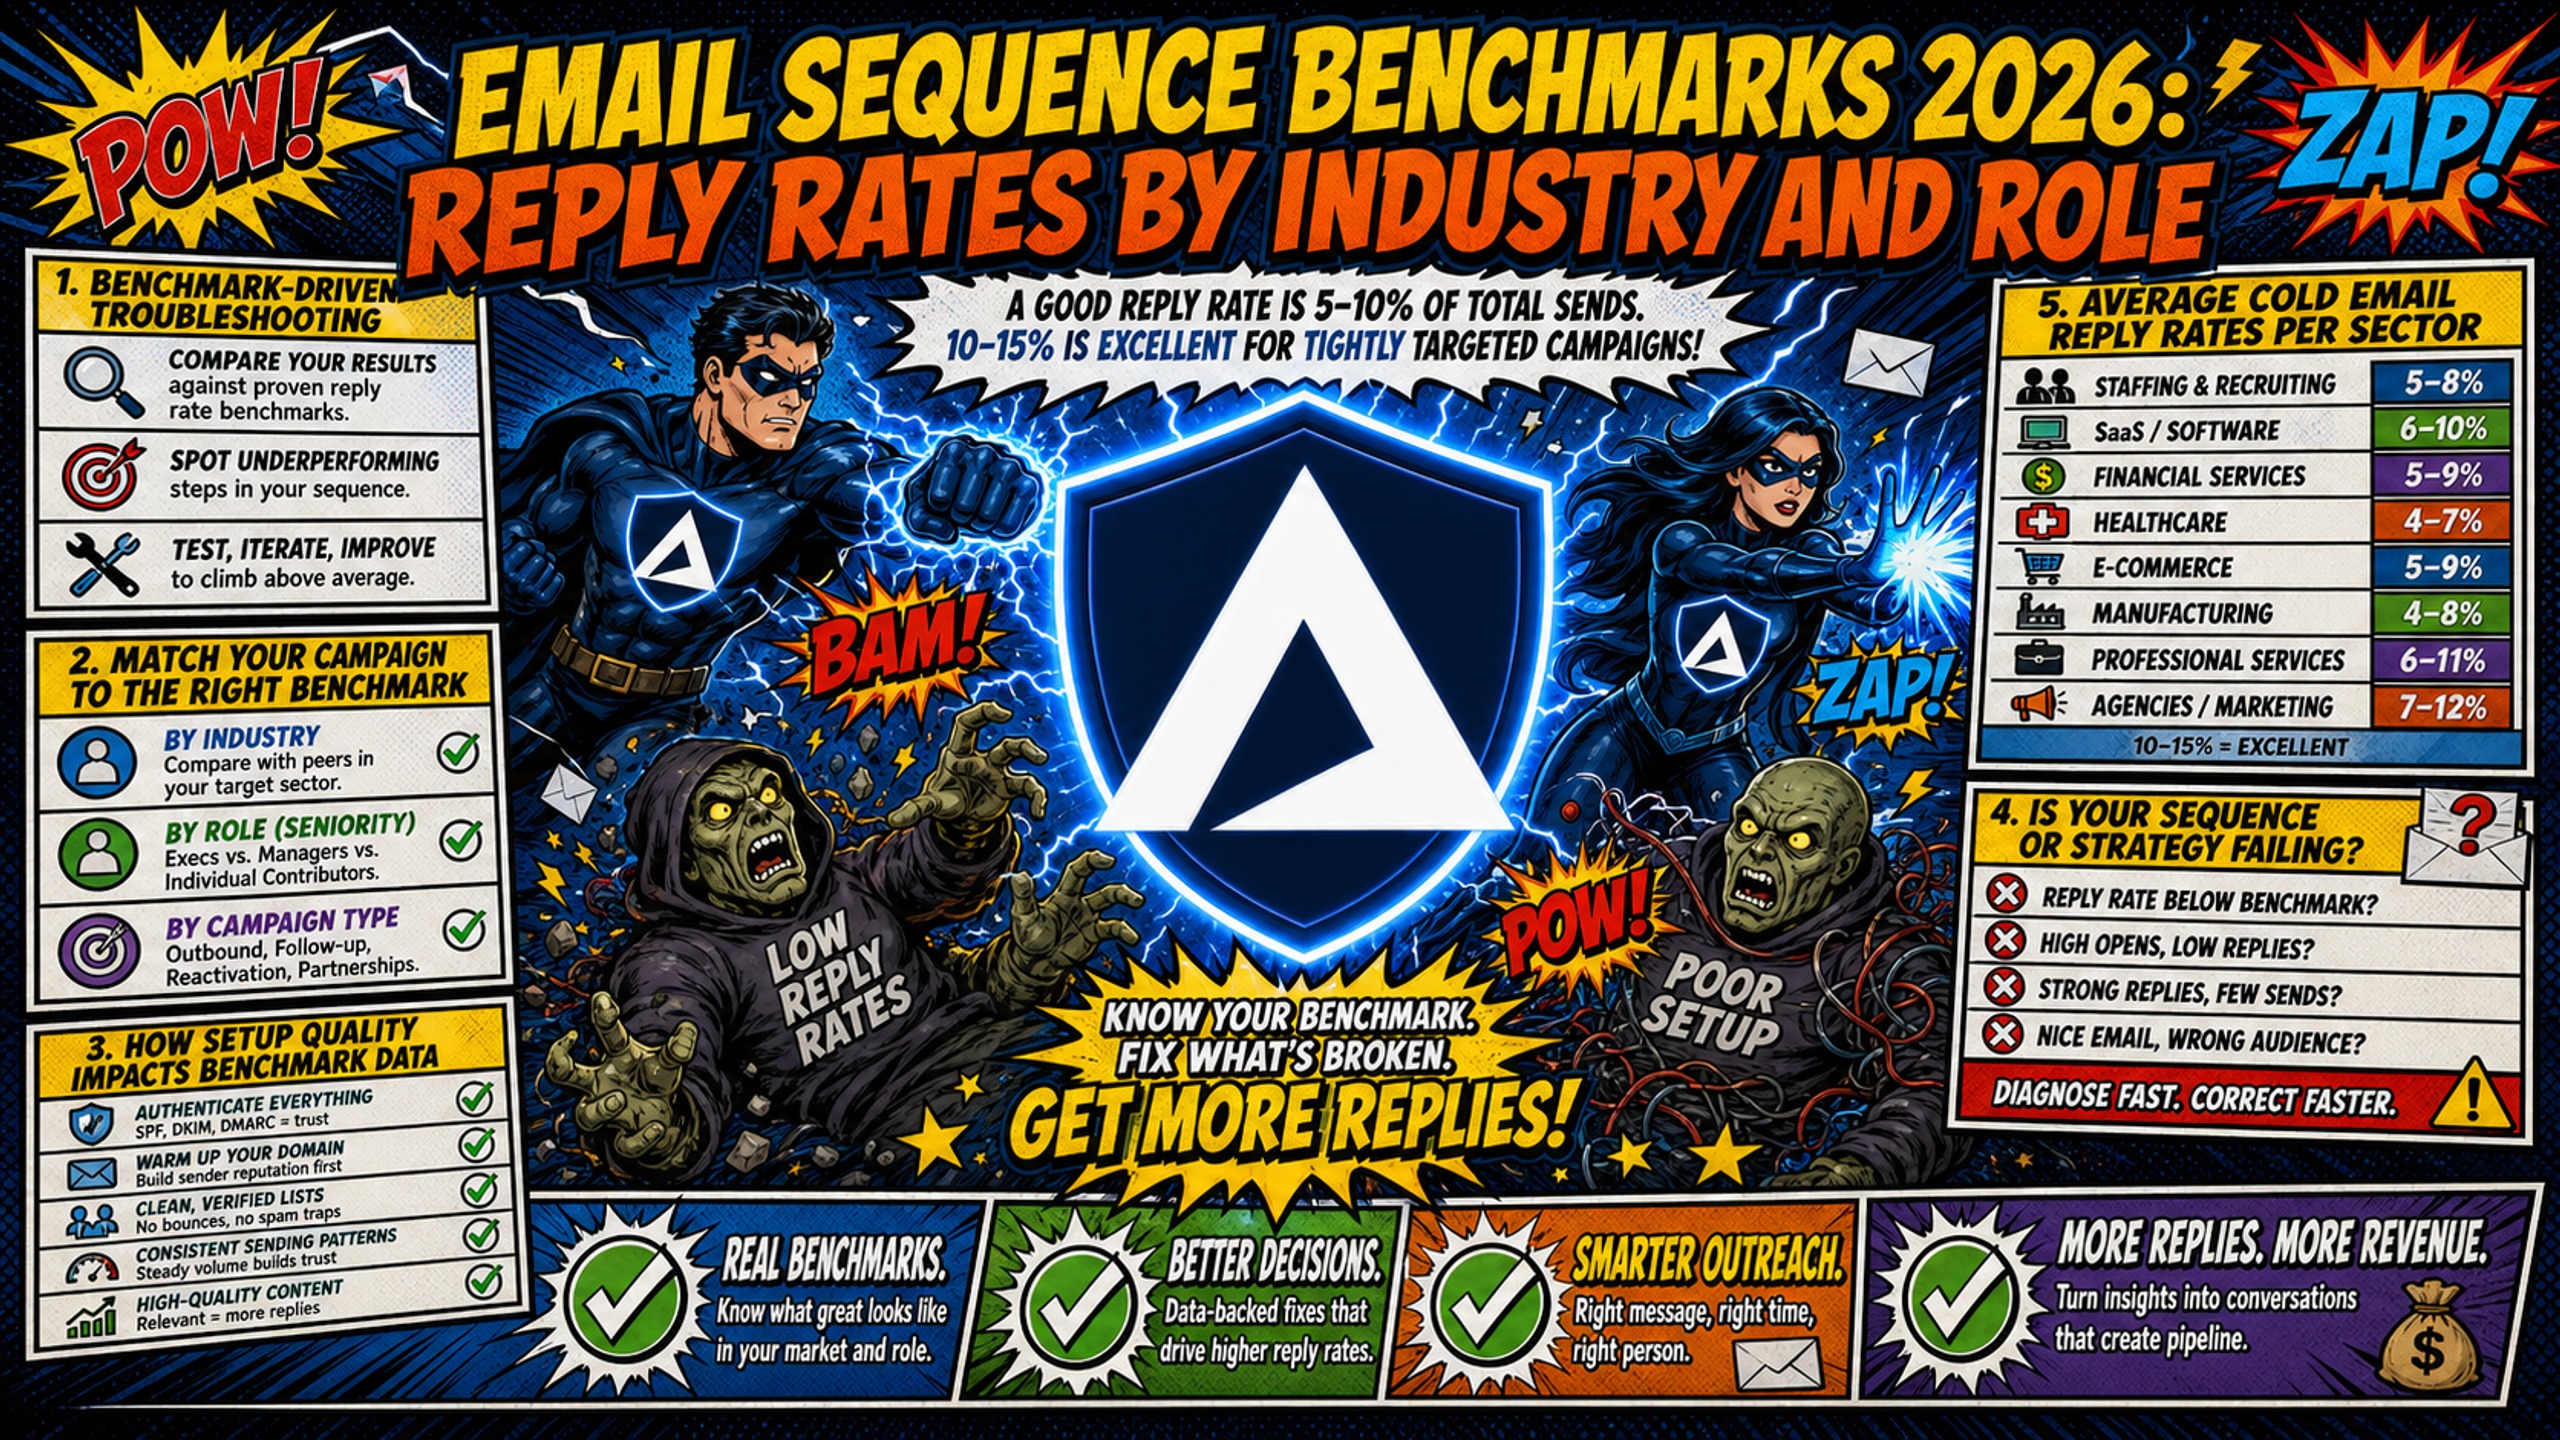
TL;DR: A good cold email reply rate in 2026 is 5-10% of total sends for tightly targeted campaigns, and 10-15% is excellent. Sector medians run lower: staffing 5-8%, agency 2.5-4.5%, SaaS 2-4%. Judge a campaign against its sector floor, not the universal band. Senior contacts reply far less often than directors or individual contributors. The metric that matters is positive reply rate, meaning replies that express genuine interest rather than an unsubscribe, a rejection, or an auto-reply. Roughly 14% of B2B cold email replies qualify. Open rates no longer work as a signal, because Apple Mail is the dominant email client and Mail Privacy Protection preloads tracking pixels for those users automatically, regardless of whether anyone reads the message. When a reply rate falls below its sector floor, check authentication, bounce rate, and IP reputation before rewriting copy.
In Woodpecker's dataset of 20M+ emails, sends to fewer than 50 contacts average 5.8% replies while sends to 1,000 or more fall below 2.1%, and when reply rates miss the sector floor, DNS configuration and IP health are worth checking before copy changes. Campaign managers report low reply rates to leadership, rewrite the sequence, and see no improvement, because the actual bottleneck is often shared IP contamination or broken authentication records upstream of the first send.
This report establishes 2026 cold email benchmarks segmented by industry, buyer role, and infrastructure setup, giving you the specific numbers to tell leadership whether a campaign needs a copy rewrite or an infrastructure overhaul.
Benchmark-driven troubleshooting for your campaigns
The sections below cover how to select the right benchmark for your campaign type and how infrastructure quality affects the data behind those figures.
Matching your campaign to the right benchmark
The single most dangerous number in cold email is the industry average. Published B2B benchmarks range from 0.45% to 2.09% depending on whether replies are measured against total sends or against delivered mail, and whether auto-replies are stripped out. That spread is not measurement noise. It is the reason a single headline average tells you almost nothing about whether your own campaign is healthy.
Apply these three tiers as your 2026 targets:
Table 1: Cold email performance tiers
| Performance tier | Reply rate | Diagnostic action |
|---|---|---|
| Underperforming | Below 2% | Investigate deliverability before touching copy |
| Average | 2-5% | Benchmark against sector and role floors before adjusting copy or infrastructure |
| Good | 5-10% | Healthy infrastructure, room to optimize messaging |
| Excellent | 10%+ | Tight targeting, solid infrastructure, refined copy |
Woodpecker's independent classification of the same dataset places 5-10% as good and above 10% as excellent, consistent with the tiers above.
If reply rates sit below 1%, the problem is almost always upstream of the copy. Inframail's campaign spam metrics guide covers the specific thresholds that signal a deliverability problem before reply rates collapse.
How setup quality impacts benchmark data
Benchmark averages are pulled down by campaigns running on shared IP pools with misconfigured DNS records. A campaign that never reaches the inbox does not fail on copy grounds. It fails before the first word is read. The table below shows cold email performance ranges across core metrics:
Table 2: Cold email benchmark quick-reference
| Metric | Underperforming | Good | Excellent |
|---|---|---|---|
| Raw reply rate | Below 2% | 5-10% | 10-15%+ |
| Positive reply rate | Below 0.5% | 0.7-1.4% | 1.4-2.5%+ |
| Meeting booked rate | Below 0.7% | 0.8-1.5% | 1.5-2.5% |
The primary KPI shifts by stage: reply rate for underperforming campaigns (with hard bounce rate kept below 2% as a health floor), positive reply rate for campaigns in the good band, and cost-per-meeting for campaigns at the excellent tier.
Is your sequence or strategy failing?
Before adjusting copy, run this two-step diagnostic. First, check your hard bounce rate. If bounces exceed 2%, the list quality is breaking deliverability, and no amount of A/B testing will fix that. Second, check whether your reply rate falls below the 2% floor for your sector. If yes, infrastructure or targeting needs attention before messaging does. For a full walkthrough on identifying whether emails are going to spam, Inframail's spam detection guide details practical thresholds by campaign type.
Average cold email reply rates per sector
Reply rate expectations differ sharply by industry. The sections below cover directional benchmarks for SaaS, agency, and staffing.
2026 SaaS cold email reply benchmarks
SaaS campaigns targeting other tech companies sit at the bottom of B2B outreach performance, with reply rates typically ranging from 2% to 4% (directional composite from multiple published datasets, no single primary source covers this vertical alone) and often falling under 2% in the most saturated segments.
The reason is saturation: a decision-maker at a mid-market SaaS company receives a high daily volume of cold pitches in 2026. Standing out requires both sharp personalization and clean inbox delivery. For a deeper look at SaaS-specific outbound strategy, Taylor Haren's SaaS cold email breakdown covers sequencing and targeting adjustments that lift reply rates in saturated inboxes.
Agency cold email performance trends
Agency senders, including marketing, design, and development shops, achieve average reply rates between 2.5% and 4.5% (directional composite from multiple published datasets), with elite performers breaking 7%. The offer is tangible in agency outreach, and prospects can quickly assess relevance, which drives higher engagement than abstract software pitches.
Infrastructure cost per inbox is the number leadership will ask for when agency reply rates come in below benchmark. At 50 inboxes, flat-rate infrastructure runs $163/month (platform plus amortized domains) versus $454 on per-seat pricing on the same basis, and that figure is the one to put in front of whoever controls the vendor budget. (Warmup tools like Warmbox or Lemwarm cost $15-50/month per inbox on both platforms and are not included in this comparison.)
Staffing firm cold email statistics
Recruiting and staffing outperform every other sector, with reply rates between 5% and 8% (directional composite from multiple published datasets) for cold outreach. The built-in relevance of the offer explains the gap: hiring pain is either active or anticipated, which means a well-timed message lands in a receptive window.
At 5-8% reply rates, staffing campaigns are still gated by inbox placement. A campaign that should produce 6% replies on properly warmed infrastructure will underperform significantly on a cold shared pool, not because the list or messaging changed, but because the first filter is the spam folder.
How buyer roles impact email reply metrics
Seniority level changes both the volume and quality of replies. The sections below cover reply rate benchmarks for C-suite, VP, director, and manager or individual contributor contacts.
C-suite email reply rate benchmarks
When a C-level executive replies, 14.16% of those replies indicate positive interest, 3.3x the manager-level positive reply share within the same Sales.co dataset. At a 0.42% raw reply rate that yields a small absolute number of conversations, but each one carries higher per-conversation value.
Short copy, extreme specificity, and a single clear call to action are the minimum requirements for C-suite outreach. Infrastructure quality matters here because a C-suite email that lands in spam delivers zero replies regardless of copy quality.
Expected reply rates for VP leads
VP-level contacts come in at approximately 0.32% in strict cold outreach datasets, close to the revised C-suite figure of 0.42%. At these figures, the raw reply rate difference between C-suite and VP is narrow. The meaningful distinction is the per-conversation value of a C-suite reply rather than a volume gap between the two tiers.
Note that the 0.32% VP floor sits below the 2% campaign-level underperforming threshold in Table 1. This does not signal a deliverability problem. Role-level floors for senior contacts operate independently of campaign-level infrastructure benchmarks, and a 0.32% raw reply rate for a tightly ICP-matched VP sequence can still represent healthy infrastructure performance.
Warmer AI's 2025 study of 427 consultant campaigns reports 11.3% for VP-level contacts, measured against contacts rather than total sends. That figure uses a different denominator than the Belkins 0.32% raw send figure, so the two are not directly comparable, but the gap does reflect how much targeting precision changes engagement at this level. For guidance on sequencing strategy at this level, Will Butler's AI-powered outbound podcast covers how personalization changes engagement dynamics for VP contacts.
Director reply rate benchmarks 2026
Director-level contacts show reply rates between 3% and 7% for cold outreach (directional composite from multiple published datasets) and as high as 17.8% in consultant-targeting sequences measured against contacts across 427 campaigns. Directors are often active evaluators of new tools, sitting close enough to operational problems to recognize a relevant solution quickly and with enough authority to move a conversation forward.
For campaign managers running mid-market outreach, directors represent the best combination of access and authority, making them the primary target for sequences aimed at meeting booking rather than deal closing.
Reply rates for frontline sender roles
Individual contributors and manager-level contacts show reported reply rates of 4% to 8% for cold outreach (figures are directional, drawn from multiple datasets without a confirmed single-source median), the most accessible band in the seniority spectrum.
They often lack budget authority, but they serve as internal champions who surface vendors to decision-makers. Campaigns targeting ICs with sequence structures designed to generate a referral up the chain, rather than a direct purchase decision, produce better pipeline quality than raw reply rate alone suggests.
Positive reply rate and meeting booked benchmarks
Raw reply rate is only part of the performance picture. The sections below define what counts as a positive reply and cover meeting booking benchmarks across industries and roles.
Defining a valid positive reply
A raw reply rate includes unsubscribes, "not interested" responses, and out-of-office auto-replies. A positive reply indicates genuine interest: a question, a request for more information, or a direct acceptance of a meeting. Conflating raw reply rate with positive reply rate produces optimistic campaign reporting that does not match actual pipeline generation.
Positive reply rates by industry
Sales.co's research shows that approximately 14% of cold email replies across B2B campaigns are positive, meaning genuine interest, questions, or meeting acceptances rather than unsubscribes or auto-replies. At a typical 2% raw reply rate, that 14% share yields roughly 0.28% of total sends as genuinely interested contacts. Top-performing campaigns with tight targeting and personalized copy push the positive share of replies above the 14% average, which translates to roughly 0.7-1.4% positive replies per total sends when raw reply rates reach the 5-10% Good band. That 0.7-1.4% per-send figure is the working target for campaign planning purposes.
Staffing campaigns lead across sectors due to the built-in relevance of the offer, while SaaS campaigns targeting saturated inboxes sit at the lower end.
Meeting booking rate benchmarks
Meeting booked rates span 0.5% to 2.5% of total sends across performance tiers, with the good band running 0.8-1.5%, consistent with Table 2. A campaign producing 1 meeting per 100 sends is performing within the good band, not at the top of the full range.
A 60-day agency case study illustrates what the upper end of this range looks like operationally, with tight ICP targeting and a structured follow-up sequence driving volume.
Turning positive replies into meetings
The conversion from positive reply to booked meeting is not guaranteed. Campaign managers who treat a positive reply as pipeline without a fast follow-up process lose a significant share of interested contacts. The final conversion rate from positive reply to booked meeting varies widely based on response speed and scheduling friction. A cold email CTA framework covering soft versus hard CTAs directly addresses how CTA structure affects this conversion step at the sequence level.
Infrastructure factors driving email reply rates
Infrastructure decisions made before a campaign launches determine a significant portion of its reply rate potential. The sections below cover warmup standards, inbox provider routing, send volume limits, and the difference between dedicated and shared IPs.
The standard 21-day warmup ramp
A new domain that sends 200 cold emails on day one has no established sender reputation. Inbox providers flag unexpected volume spikes and route messages to spam before a human sees them. According to Inframail's inbox warmup guide, the standard warmup approach starts new domains at 10 emails per day and scales gradually over a minimum 21-day period.
All benchmarks in this report reflect campaigns running on domains with 21+ days of warmup. Comparing a new domain's early-send performance against these figures produces a false infrastructure diagnosis, because inbox placement is suppressed by design until sending reputation is established.
Inframail's platform requires external warmup tools (Warmbox or Lemwarm, at $15-50/month per inbox) unless using the Done-for-you campaign setup package, which includes managed warmup. Building warmup cost into the monthly infrastructure spend before comparing infrastructure options prevents budget surprises after onboarding.
How Microsoft-to-Google routing affects replies
Microsoft-to-Google routing is a real deliverability variable in 2026. Sending from Microsoft infrastructure (Inframail's base) to Gmail recipients involves cross-ecosystem authentication checks, which makes SPF, DKIM, and DMARC records critical. Both Google and Yahoo tightened sender requirements in February 2024, pushing campaigns without proper authentication out of inboxes and raising the baseline for senders who configure correctly. Inframail automates SPF, DKIM, and DMARC configuration at domain setup, removing the manual step that most campaign managers skip or configure incorrectly.
The SaaS and agency reply rate ranges in this report (2-4% and 2.5-4.5% respectively) reflect senders with passing SPF, DKIM, and DMARC. Unauthenticated campaigns in the same sectors run materially below those floors, which is why authentication is the first diagnostic check before comparing against sector benchmarks.
Send volume per inbox per day
The commonly recommended practice is 30-50 cold emails per inbox per day for established, warmed domains. For domains still in warmup, Inframail's warmup guide recommends staying at 20-30 emails per day until the ramp is complete, not as a permanent ceiling. Distributing volume across 3-5 domains per client keeps total campaign output at workable levels without overloading any single inbox.
For guidance on calculating the right number of inboxes for a given send volume, Inframail's sending capacity guide provides the math for matching inbox count to campaign targets. Sending above the 30-50 daily range on a warmed domain risks inbox providers routing excess sends to spam, which suppresses reply rates below sector benchmarks without any change to copy, targeting, or list quality.
Comparing dedicated vs. shared sender IPs
Shared IP pools work like carpool lanes where one bad actor affects every other sender on the same range. A single user sending high-bounce, spam-reported email gets the entire IP flagged, which drops inbox placement rates for everyone sharing that range, including your active campaigns. Dedicated IPs work like private lanes where your behavior alone determines reputation.
This advantage requires consistent send volume to hold. Dedicated IPs need around 100,000 emails per month as a practical minimum to build a stable reputation signal with mailbox providers. Below roughly 50,000 per month, a well-managed shared pool is often the better option, because low volume gives mailbox providers too little data to establish a stable reputation on a dedicated IP. Note that an agency running 3-5 domains per client at 30-50 sends per day sits at roughly 45,000 to 75,000 emails per month, which places most agencies at or near this threshold rather than clearly above it.
Inframail's Unlimited Plan ($129/month) includes 1 dedicated US-based IP. The Agency Pack ($327/month) includes 3 dedicated IPs. Inframail's infrastructure cost comparison shows how dedicated IP availability differs across providers, including Maildoso (which uses automatic IP rotation) and Mailforge (which uses a shared pool).
Key drivers of cold email reply rate variance
Not all campaigns start from the same baseline. The sections below cover the data sources behind these benchmarks, list hygiene standards, and bounce thresholds that determine whether infrastructure can perform at rated levels.
Data sources for 2026 reply benchmarks
Platform-wide figures in this report draw from published analyses including Woodpecker's dataset of over 20 million cold emails, which segments by campaign size, personalization level, sequence length, and step position, but not by industry or job title. None of the platform-wide sources segment by the three verticals or seniority levels this report covers.
Sector and role ranges are directional composites assembled from multiple smaller published datasets, including Belkins' analysis of 7,530,489 cold emails segmented by seniority level and Sales.co's analysis of 2 million+ cold emails, and should be treated as directional rather than definitive figures. Saleshandy's dataset of 53.1 million cold emails across 60,000 sequences, covering January to June 2026, segments by region, sequence size, and channel mix.
List freshness and multichannel touchpoints
List freshness matters more than send frequency. Contacts who show no signal of engagement (no click, no reply, no out-of-office) after the first two touches are unlikely to respond to a third, which reinforces the 3-touch cadence limit. The day 6-7 final touch captures the portion of contacts who read the first email but needed a second prompt before responding, not contacts who were unresponsive from day one. Stale lists produce low engagement rates that drag down averages and trigger spam filters.
For list hygiene options that keep contact data current, Inframail's Zerobounce vs. Neverbounce comparison covers the two tools most campaign managers use.
Key bounce metrics for sequence health
Keep hard bounces below 2% regardless of segment. Above that threshold, inbox providers flag the sending domain as a potential spam source, compressing reply rates on subsequent sends from the same IP. A hard bounce rate above 2% signals a list quality problem that no infrastructure change will fix. The source issue is almost always outdated contact data (role changes, company closures) or purchased lists that were never verified. List hygiene is the primary control variable, and verifying contacts before sending is the standard approach for staying below that ceiling.
Diagnosing underperforming email sequences
When reply rates fall below sector benchmarks, the cause is usually identifiable before touching copy. The sections below cover infrastructure tests, ICP refinement, copy adjustments, and send cadence.
Critical infrastructure tests to run now
If reply rates are below the sector floor, run these four checks in order before editing any copy:
- SPF record check: Verify the SPF record is correctly formatted and includes your sending platform's IP range. A missing or broken SPF record causes authentication failures that route emails to spam.
- DKIM verification: Confirm DKIM signatures are passing at the receiving mail server. Failed DKIM sends flag as suspicious at both Gmail and Outlook.
- DMARC policy check: Confirm a DMARC record exists and the policy is set to at least "p=none" for new domains and "p=quarantine" for established ones.
- Blacklist check: Run the sending IP against major blacklist databases. Inframail's blacklist monitoring dashboard automates this check and submits delisting requests when a domain is flagged, with a 68.3% delisting success rate within 48 hours.
Inframail automates steps 1-3 at domain setup. The Inframail + GoHighLevel setup walkthrough shows the full domain-to-campaign workflow, from purchase through CSV export and import into a sending platform.
Refining your ideal customer profile
Tight ICP targeting prevents spam reports, which protects sender reputation on subsequent sends. A broad campaign to 10,000 loosely matched contacts generates spam reports at a higher rate than a targeted campaign to 500 tightly matched ones. Each spam report against your sending domain increases the likelihood that the next send routes to the spam folder, compressing reply rates across all active campaigns on that infrastructure. The Inframail Microsoft blacklist guide details how spam complaints accumulate into blacklist events and how to recover when they do.
Refining messaging for higher replies
Once infrastructure is confirmed clean, three copy adjustments raise reply rates:
- Cut word count: Decision-makers read the first two sentences before deciding whether to continue. Keeping emails under 150 words reduces friction before a reply decision is made.
- Use a single CTA: Multiple asks reduce clarity and increase friction. One specific ask (a 15-minute call, a yes/no question) outperforms a menu of options.
- Lead with the prospect's problem: Opening with a relevant observation about the prospect's business outperforms opening with your company's value proposition.
For CTA structure and copy frameworks, the killer cold emails reply rate breakdown covers specific constructions that improve positive reply rates.
How cadence impacts cold email replies
A common cadence approach is 3 total touches per prospect: an initial email, a follow-up after 3 days, and a final follow-up 6-7 days later. Sending more frequently than that can increase unsubscribe and spam report rates without a corresponding lift in replies. Spacing follow-ups at 3-4 day intervals maintains visibility without triggering aggressive filtering from inbox providers. Platform-wide datasets that include warmer and permission-based sending find optimal sequence length closer to 4-7 touchpoints. The 3-touch limit above applies specifically to cold outreach targeting new contacts, where diminishing returns and spam report risk arrive earlier than in warmer or permission-based sending.
The table below shows how reply volume distributes across a standard 3-touch sequence. Sequencing decisions (spacing, touch count, CTA shift per touch) affect how this distribution lands for any individual campaign.
Table 3: Reply rate distribution by sequence touch
| Touch | Timing | Share of total sequence replies |
|---|---|---|
| Touch 1 (initial email) | Day 1 | ~55% |
| Touch 2 (first follow-up) | Day 3–4 | ~28% |
| Touch 3 (second follow-up) | Day 6–7 | ~12% |
The practical implication: if Touch 1 is significantly underperforming its expected 50-60% share of total replies, the problem is almost always deliverability or ICP mismatch, not follow-up spacing. If Touch 1 performs well but Touch 2 drops sharply, the issue is usually copy relevance or CTA friction on the follow-up. Touches beyond three add minimal lift against total sequence replies and increase unsubscribe and spam report risk.
How to interpret your email sequence metrics
The sections below cover how to apply these benchmarks to campaign reporting, testing duration, warmup considerations, and leadership communication.
2026 cold email reply rate targets
Use these ranges as the working baseline for campaign performance reporting:
Table 4: 2026 reply rate targets by seniority
| Seniority | Expected reply rate | Notes |
|---|---|---|
| C-suite | 0.42% raw (C-level), ~0.57% (founders/owners) | Highest per-conversation value |
| VP-level | 0.32% raw | Narrow ICP required |
| Director (cold outreach) | 3% - 7% | Best access + authority balance (directional composite from multiple published datasets) |
| Director (consultant sequences) | 17.8% | Warmer AI 2025, measured against contacts, not total sends |
| Manager / IC | 4% - 8% | High volume, champion-building |
Note: Seniority figures come from different studies with different denominators. Belkins measures against total sends, which produces lower absolute figures than benchmarks measured against delivered mail. Compare within a row, not across rows.
Table 5: 2026 reply rate targets by sector
| Sector | Typical reply rate |
|---|---|
| SaaS | 2% - 4% |
| Agency | 2.5% - 4.5% (elite: 7% ) |
| Staffing | 5% - 8% |
Testing duration for sequence performance
Run a sequence through 500-1,000 contacts before drawing conclusions about copy performance. Smaller sample sizes produce variance that looks like a trend. A 50-contact test that shows 8% replies might reflect three lucky timing hits, not a repeatable framework. At 500 contacts with consistent infrastructure (same domains, same IPs, same warmup status), the reply rate reflects actual message quality. Inframail's plan selection guide covers how to match inbox count to target send volumes.
Do benchmarks account for warmup volume?
All benchmarks in this report apply to active, warmed-up sending domains. Cold domains (fewer than 21 days of warmup) operate below these benchmarks regardless of targeting or copy quality, because inbox placement rates are lower until sending reputation is established. Inframail's warmup migration guide covers how to maintain warmup continuity when switching infrastructure providers.
How do I explain low reply rates to leadership?
Stop reporting open rates. Apple Mail is the dominant email client, and Mail Privacy Protection preloads tracking pixels for those users automatically, regardless of whether the recipient ever reads the message.
Switch to positive reply rate and meetings booked as the primary KPIs. Both are immune to Apple Mail Privacy Protection (MPP) inflation and directly reflect pipeline impact. When leadership asks whether performance is "good," point to the sector and role benchmarks above and frame the infrastructure cost comparison alongside it.
External benchmarks are a starting point, not a target. Run A/B tests within your own campaigns to establish the internal baseline that reflects your specific ideal customer profile (ICP), offer, and sending infrastructure. Reviewing your current 30-day stats against the previous 30-90 days builds a baseline specific to your ICP, sending frequency, and offer, which will serve as a more useful diagnostic tool than generic benchmarks for your specific campaigns.
Infrastructure cost per inbox at benchmark scale
Infrastructure spend determines how long a campaign runs before budget pressure forces a reduction in domain count or contact volume. A campaign cut short at 300 contacts produces unreliable benchmark comparisons. The figures below are the ones to bring to leadership when justifying infrastructure choice, because sustained send volume is the baseline requirement for the 500-1,000 contact testing window described above.
For 50 inboxes, Google Workspace Business Starter on the Flexible Plan costs $8.40 per user monthly, totaling $420/month. Inframail's Unlimited Plan costs $129/month for unlimited inboxes on a dedicated IP, plus approximately $34/month in amortized domain costs, for a total of $163/month. That $291/month difference (with domain costs counted on both sides, versus $187-257/month comparing platform fees alone) stays in margin even when reply rates run below benchmark during a ramp period. (Warmup tools like Warmbox or Lemwarm cost $15-50/month per inbox on both platforms and are not included in this comparison.)
"The setup is ridiculously fast. SPF, DKIM, DMARC, forwarding - all handled in literally seconds without me having to dig through docs or guess what records to add. Unlimited inboxes on a flat price? That alone saves me hundreds every month compared to Google Workspace or similar." - Verified user review of Inframail
Table 6: Monthly infrastructure spend at 50 inboxes
| Cost variable | Google Workspace (Flexible) | Inframail (Unlimited Plan) |
|---|---|---|
| Platform fee | $420/month ($8.40 x 50) | $129/month |
| Domain costs (amortized) | ~$34/month (priced separately) | ~$34/month (priced separately) |
| Warmup tool (external) | Required separately* | Required separately* |
| Total monthly cost | ~$454/month + warmup | ~$163/month + warmup |
*Warmup tools (Warmbox, Lemwarm) typically cost $15-50/month per inbox on both platforms. Inframail's Done-for-you campaign setup package includes managed warmup as part of the service.
For campaign managers reporting infrastructure cost across multiple client accounts, the Inframail vs. Mailreef comparison and Maildoso alternatives guide show how per-inbox pricing compounds as domain count grows, giving you the line-item data to report upward.
Start sending on dedicated infrastructure
Inframail is a flat-rate Microsoft email infrastructure platform built for agencies and outbound teams running 50-200 cold email domains. Inframail runs on Microsoft's cloud platform, which means it does not support Google Workspace inboxes. Senders who need Gmail-based infrastructure will need a different provider.
The Unlimited Plan costs $129/month for unlimited inboxes on a dedicated US-based IP, with SPF, DKIM, and DMARC automatically configured at domain setup. Inframail's blacklist monitoring tracks domain health and submits delisting requests automatically, with a 68.3% delisting success rate within 48 hours. Inframail publishes a 98%+ deliverability rate.
Sign up to Inframail and get started today. Teams that want managed domain warmup and a dedicated cold email coach from day one can use the Done-for-you (DFY) email campaign setup, which handles the full infrastructure stack at $3,497 one-time or $499/month.
FAQs
What is a good cold email reply rate in 2026?
A good cold email reply rate ranges from 5% to 10% of total sends for tightly targeted campaigns, while excellent campaigns achieve 10% to 15%. Sector medians run lower than that universal band: staffing 5-8%, agency 2.5-4.5%, SaaS 2-4%. Judge a campaign against its sector floor rather than the universal band. The underperforming threshold is below 2% of total sends, which is the signal to investigate deliverability before touching copy. At high volume and scale, reply rates compress toward 2.1% or below, while tightly targeted batches of 50 recipients or fewer reach 5.8%.
How much does Inframail cost compared to Google Workspace?
Inframail costs $129/month for unlimited inboxes on the Unlimited Plan, while Google Workspace costs $8.40 per user monthly on the Flexible Plan, equaling $420/month for 50 inboxes. Adding approximately $34/month in amortized domain costs to both brings Google Workspace to roughly $454/month and Inframail to approximately $163/month. Warmup tools like Warmbox or Lemwarm cost $15-50/month per inbox on both platforms and are not included in this comparison.
Does Inframail include built-in email warmup?
No. Inframail requires external warmup tools like Warmbox or Lemwarm, which typically cost $15-50/month per inbox. The Done-for-you campaign setup package includes free warmup as part of the managed service.
Why are open rates unreliable for measuring cold email performance in 2026?
Apple Mail is the dominant email client, and Mail Privacy Protection preloads tracking pixels for those users automatically, recording an 'open' whether or not the recipient ever reads the message. Positive reply rate and meetings booked are the reliable alternatives.
What is the difference between a raw reply rate and a positive reply rate?
A raw reply rate includes every response: unsubscribes, "not interested" replies, and out-of-office auto-replies. A positive reply rate counts only responses indicating genuine interest in a conversation. Positive reply rates for campaigns in the good band (5-10% raw reply) run 0.7-1.4% of total sends, with top-performing campaigns pushing above that as positive share of replies rises above the 14% average.
How does a dedicated IP improve cold email reply rates?
A dedicated IP isolates your sender reputation from other users' sending behavior. On shared IP pools, a single bad actor's spam-reported sends can flag the entire IP range, dropping inbox placement for every sender on that pool. Dedicated IPs need consistent volume to hold reputation. Around 100,000 emails per month is the practical minimum, and below roughly 50,000 per month a well-managed shared pool is often the better option, because low volume gives mailbox providers too little data to build a stable reputation signal on a dedicated IP. Inframail's Unlimited Plan includes 1 dedicated US-based IP, and the Agency Pack includes 3.
How do I connect Inframail to Smartlead or Instantly?
Inframail provisions IMAP/SMTP credentials for each inbox and exports them to CSV. That CSV imports directly into Instantly and Smartlead. For a step-by-step walkthrough of the Smartlead integration, Inframail's Smartlead connection guide covers the full process from credential export to active campaign.
Key terms glossary
Dedicated IP: An IP address used exclusively by one sender, protecting their email reputation from being affected by other senders' behavior on a shared pool.
Inbox placement rate: The percentage of sent emails that land in the recipient's primary inbox rather than the spam or promotions folder.
SPF/DKIM/DMARC: Technical DNS records that verify a sender's identity and prevent email spoofing. All three must be correctly configured for inbox providers to authenticate and trust inbound messages.
Positive reply rate: The percentage of total sends that generate a response indicating genuine interest in a conversation, excluding unsubscribes, auto-replies, and "not interested" responses.
Warmup schedule: A gradual ramp-up of daily send volume from a new domain over a minimum 21-day period, starting at 10 emails per day and scaling gradually to establish sender reputation with inbox providers.
Hard bounce: An email that permanently fails to deliver due to an invalid address or domain. Hard bounce rates above 2% of total sends signal list quality problems that damage sender reputation.